Optical Tables 101
What You Need to Know About Optical Tables
VIBRAPLANE Vibration Isolation Protects the Critical Subsystems of Large Equipment
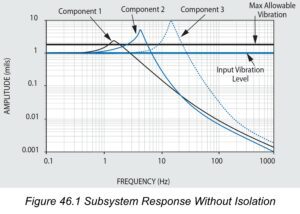
All complex assemblies include components with natural frequencies that are critical because they exist in the generalized 8 to 200 Hz environmental spectrum.
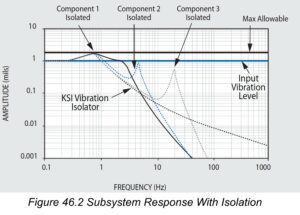
For illustration, Figure 46.1 shows the Transmissibility and resonant responses of three components in typical equipment. The resonant responses, or Q’s of these components exceed the allowable level, which is set at Q=1.75 for this example. Figure 46.2 shows the responses of the same components above, after the introduction of isolation at 1 Hz. The roll off isolator transmissibility acts to reduce the input to each of the three critical components illustrated. Now without altering the design of each component, their respective resonant responses are all below the allowable limit, and no failure will occur.
KSI Optical Tables… Better Built Through Better Design
At KSI, we’ve taken all the guesswork out of selecting optical tables and vibration control equipment. We have developed pre-engineered rigid and high natural frequency honeycomb optical tables, breadboards, and modular rigid supports (upgradeable to vibration isolators) to provide you with cost-effective solutions for any vibration environments you encounter. The choice is simple. For precision applications in severe or unknown vibration environments, we recommend highly damped honeycomb optical tables such as our 5300 Series and Active-Air vibration isolation systems. For normal or moderate environments we offer economical, broadband damped tables such as our 5200 Series or 5100 Series with Isolators or our Modular Rigid Supports.

Understanding Optical Table Specifications
At present there is no single accepted standard practice for comparison of optical tables from different manufacturers. This accounts for much of the unnecessary complexity in technical performance specifications introduced by different makers.
At KSI, we want you to be aware of the important difference between reality and specification hype. For example – flatness, stiffness, weight, static deflection, dynamic compliance, natural frequency, and damping are real properties of any optical table, and these are directly measurable by standard instruments and techniques. However, some manufacturers use theoretical estimates of intangible performance parameters which cannot be verified. For optical table selection and comparison, real measured data and test results can never be replaced by theoretical computed estimates based on idealized assumptions and unproven hypotheses.
Consider the Basics When Selecting and Specifying Optical Tables
There is so much technical jargon and unnecessarily complicated static and dynamic deflection concepts being used to sell optical tables and vibration isolation equipment that it’s easy to become confused and distracted from what you really need to know. We would like you to review the following basics so you can feel confident when selecting an optical table or isolation system for your application.
Natural Frequency
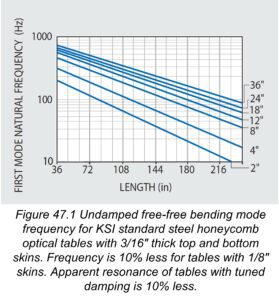
Optical tables should have a high natural frequency (preferably above 90 Hz) to avoid coincidence with prominent low frequency sinusoidal building vibrations typically occurring between 6 and 60 Hz. At KSI, we provide one piece tables in popular sizes up to 6 feet (1.83m) by 16 feet (4.88m) whose lowest natural frequency is 90 Hz or better to protect you from resonance with building vibrations. You can see this in our natural frequency graph in Figure 47.1. If the (length/width) ratio of the table is equal or greater than 1.33 the lowest frequency mode will be free-free bending, otherwise the lowest mode will be free-free twisting. For custom applications we can manufacture large tables with special tooling or by splicing one or more tables together. These will have lower natural frequencies which may be extrapolated from Figure 47.1.
Static Deflection
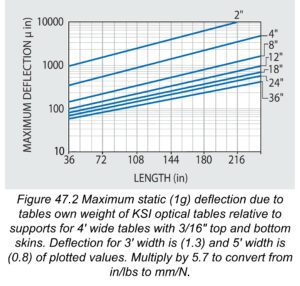
Optical tables should be stiff to minimize relative deflection, or sag, between supports due to their own weight. High stiffness in our tables and breadboards is insured by our proprietary damped rigid epoxy, and is not compromised by plastic or viscoelastic laminations. The high stiffness of our tables is confirmed by their high natural frequencies in Figure 47.1 and the corresponding very small static deflections shown in Figure 47.2. The maximum static (1g) deflection of KSI tables relative to their supports has been tested and conforms to simple beam deflection theory. It should also be noted that the tables’ static deflections are significantly less than their flatness tolerances.
Deflection Due to Equipment Load
In addition to minimizing static deflection, the high stiffness of our tables minimizes relative deflection due to weight of components and equipment installed on the table. If you assume that the installed equipment is uniformly distributed across the table, then the added table deflection due to the equipment is determined simply by multiplying the deflection from Figure 47.2 by the (equipment/table) weight ratio. If you are using heavy equipment, we recommend that you repeat this deflection computation with different table lengths and thicknesses until you obtain an acceptably low value, say 10%, of the precision required by your application.
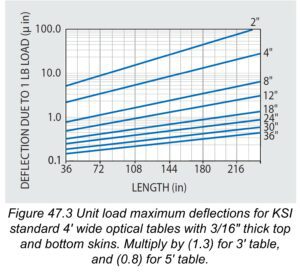
Unit Load Deflection
The maximum relative deflection due to a one-pound concentrated load centered on the table should be minimal and is presented in Figure 47.3. As is the case with our table static weight deflection tests, results show that unit load deflections also conform closely with simple beam deflection theory. To calculate the deflections due to higher magnitude concentrated loads at the center, simply multiply the unit load values in Figure 47.3 by the higher load value. For example, if the deflection due to a 250 lb load is desired, multiply the graph value by 250 for the selected table size.
Optical Table Weight
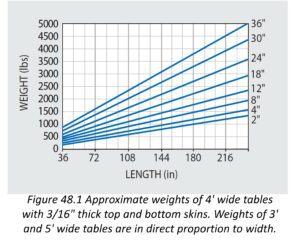
Figure 48.1 presents the approximate weights for 48″ wide 5300 Series tables of various standard thicknesses. The weights of other corresponding tables of different width and skin thickness may be estimated by multiplying the values in Figure 48.1 by the ratios of (actual width/48″) or (actual skin thickness/ .180″) as appropriate. Our steel honeycomb optical tables are inherently structurally efficient and weigh substantially less than a solid steel or granite equivalent flat surface plate. Nevertheless, a certain amount of weight is desirable for stability and resistance to vibratory forces. Thickness and length govern the table weight. Two rules of thumb are: (1) the table should weigh between 2.5 and 5 times the mounted equipment; and (2) the minimum table thickness should be between 6% and 10% of the length. Use these rules to define the minimum weight of your table selection. For example, for precision applications the minimum recommended standard thickness of a 10′ long table should be 8″ or 12″ thick.
Static and Dynamic Deflection and Compliance
In optical tables it is customary to quantify dynamic deflection in terms of Compliance, which is simply the deflection response to a unit force. In static or steady state conditions, Compliance is easily identified as “inverse” stiffness, or flexibility in engineering units of deflection per unit force.
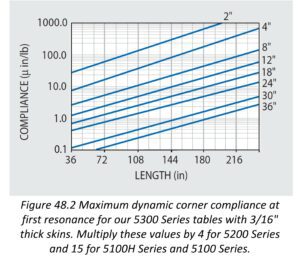
The Unit Load Deflections in Figure 47.3 can be regarded as a graph of Static Compliance values at the centerpoints of the tables presented. In contrast, Dynamic Compliance is the deflection response due to a unit vibratory force. Hence vibration frequency, table resonance and internal damping will define maximum response deflection. The table’s dynamic response at the corner; i.e.; Corner Compliance, has become a standard measurement for specification comparisons.
Damping and Dynamic Compliance
Optical tables should possess sufficient internal structural damping (energy dissipation) to control their relative deflection resonant response to random high frequency building vibration. Internal damping also minimizes modal resonant response to transient disturbances.
The excellent damping properties in all our VIBRAPLANE Optical Tables is demonstrated by the typical  Compliance Spectra included in the technical data with each of our products.
The Compliance Spectra serve the same function as conventional Transmissibility Curves. These characterize the system response deflection, including resonant amplification, as a function of frequency. A low resonant response is one of the important criteria for selection of optical tables.
The resonant Q factor, or maximum transmissibility of the lowest resonance mode for KSI Optical Tables is set during production in a range as follows:
5300 Series: Q = 2–6
5200 Series: Q = 6–9
5100T Series: Q = 9–13
5100H Series: Q = 13–18
5100 Series: Q = 18–25
The corresponding Maximum Compliance values for 5300 Series Tables are represented in Figure 48.2.
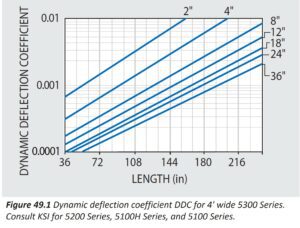
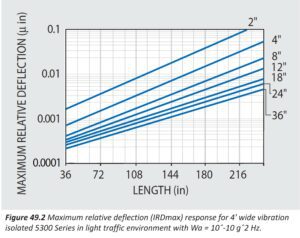
To aid you in the selection of optical tables for your application we provide you with manufacturing specifications in addition to real measured and verifiable static and dynamic table properties such as shown in Figures 47.1 to 49.2. However, for reference purposes and comparison to various manufacturers’ calculated table specifications, we want you to know that regardless of model or price category, the computed or predicted “Dynamic Deflection Coefficients” and “Maximum Relative Deflection”responses of KSI honeycomb tabletops are the lowest in the industry. These are presented in Figures 49.1 and 49.2 as discussed.
Theoretical Considerations in the Optical Table Relative Deflection Response Hypothesis
If we assume that the severity of laboratory floor vibration is statistical in nature and truly random, like white noise, then the rms (root mean square) relative deflection response RD of an idealized rigid lumped mass single degree-of-freedom system will be defined as follows 1 :
RD = (y-x) =
W a Q g 2 / 32 (pie symbol) 3 f n 3 ) 1/2 =
12.25 (W a Q / f n 3 ) 1/2 (8)
Where:
(Q / f n 3 ) 1/2 =
(DDC) = Dynamic Deflection
Coefficient of tabletop (9)
Q = Resonant transmissibility of table
W a = Floor Random Vibration Spectral Density,
(g 2 /Hz = floor mean squared vibration acceleration per 1 Hz band)
RD max = (nonisolated) maximum Relative Deflection of tabletop on rigid supports
Typical estimated random floor vibration conditions are:
Light traffic: W a = 10 -10 g 2 /Hz
Heavy Traffic: W a = 10 -9 g 2 /Hz
Light Manufacturing: W a = 10 -8 g 2 /Hz
Heavy Manufacturing: W a = 10 -7 g 2 /Hz
The Dynamic Deflection Coefficient (DDC) for 5300 Series Tables is derived from Equation (9) in conjunction with natural frequency and Q data contained in Figures 47.1 and 48.2, and plotted in Figure 49.1 for ready reference.
In vibration analysis it is reasonable to assume that an optical tabletop can be represented as a rigid mass-spring-and-damper single degree-of-freedom system up to its first resonance. Therefore, the above single degree-of-freedom Equation (8) is only applicable to a tabletop without isolation supports.
If isolators are added, the system has additional deflection coordinates or degrees-of-freedom and Equation (8) is not applicable. To resolve this in a simplified (quasi-theoretical) manner, Industry has proposed two correction factors and a modified interpretation of damping parameter Q . The correction factors are:
- Multiply Equation (8) by isolator transmissibility assumed as T = 1% at high frequency to, in effect, eliminate one degree-of-freedom.
- Multiply by 2 for an arbitrary worst case; and;
- Use the apparent Q from corner compliance tests used to derive Figure 49.2. We refer to the latter Q as apparent because it includes both rotation and translation response motions, instead of one degree-of-freedom as theoretically required. The resulting equation for Isolated Maximum Relative Deflection (IRD max ) for a vibration isolated tabletop is as follows:
IRD max = 12.25 (W a Q / f n 3 ) 1/2 x 0.02 (10)
The Maximum Relative Deflection of vibration isolated 5300 Series tabletops is derived from Equations (8) and (10) in conjunction with Figure 49.1 and is presented in Figure 49.2 for ready reference.
We’re here to help you select the right vibration-free optical table or workstation, or design a custom one that will meet your exact requirements. Click here to talk with one of our experts.

1 Crede, C.E. “Failure Resulting From Vibration”, Random Vibration, Volume 2, Edited by S.H. Crandall, MIT Press, 1963